Successful companies are able to acquire and retain a substantial number of customers.
It sounds simple, but it’s so difficult to achieve.
Even if you’ve discovered a problem that a lot of people have, you still must build a solution that works. And if you’ve done those things and achieved product/market fit, then the next challenge is to acquire and retain your most loyal customers. And you have to be able to consistently acquire those loyal customers. I’ll show you a tool that can help you do that in this post.
Knowing Who Your Most Loyal Customers Are
There are many ways we can describe “loyal.” It can be highest lifetime value, frequent use of product, high viral coefficient, etc. It varies for every business. Our example is a SaaS company, and we’ll use login retention as our metric. This measures users by how often they log in.
The Tool
Okay, so we know the metric we’ll use to measure customer loyalty. Now we need to find the tool that will measure this for us.
First, it’s helpful (and, in fact, the best method) to group people into cohorts. A cohort is a group of people who share a common characteristic or experience within a defined period. For example, the people who signed up for your product during the month of April could be put in a cohort called “April Signups Cohort.”
The best tool for tracking cohorts is the KISSmetrics Cohort Report. It’s simple to use, tracks every person in each cohort, and delivers reliable data. What more could you ask for?
Setting Up the Report
Here’s the setup for the Cohort Report:
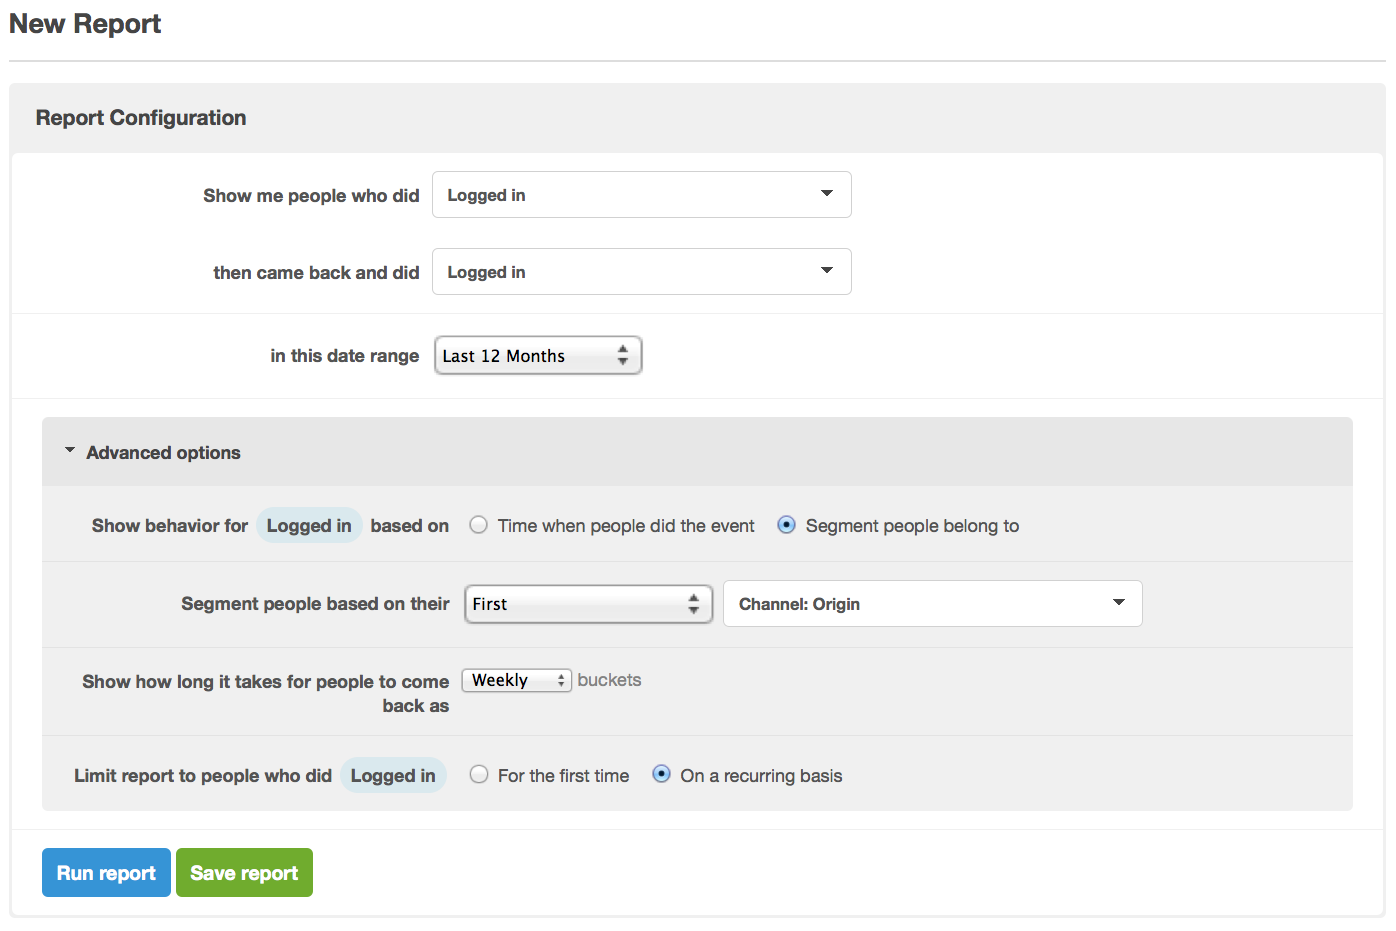
In the top half, we select the events to group people by. For our report, we’re choosing Logged in because we want to see the people who logged in, and then logged in again. Logged in is not an automatically tracked event in KISSmetrics, but you can set it up with a little help from a developer.
The bottom half (under Advanced options) is where you can tinker with your data. You can group people by the time they logged in, or by a segment. Our report will segment people by Channel: Origin. This will tell us which marketing campaigns are correlated with customer loyalty. So, do people coming from AdWords have the most logins, or people coming from an organic search? We’ll see.
We then choose how often we record them as coming back. Again, this varies for each product. Some companies would like users to log in every day. Facebook and Twitter are common examples, as they use “Daily Active Users” as a key metric. Other products, such as About.me, require far fewer logins. It’s more of a “set it and forget it” product. In our example, we’ll use weekly. If users don’t log back in after a week, they aren’t counted in that cell/bucket.
Finally, we choose whether to count the first time the user did the event or on a recurring basis. Logins need to be counted every time. An example of an event that would not need to be counted on a recurring basis is Signup. People sign up only once, so there would not be any need to count people who do more than one signup.
Everything in our setup looks good. Now it’s time to hit Run Report and view our data.
Viewing the Data
Below is our data visualization. In the two columns on the left, we see the number of people who have logged in, grouped by the channel they came from. For example, the 944 people in Paid: AdWords originally came to us via an AdWords advertisement. On the right is the percentage of those people who logged back in again in the weeks following May 1. The > 12 column is for logins counted after 12 weeks.
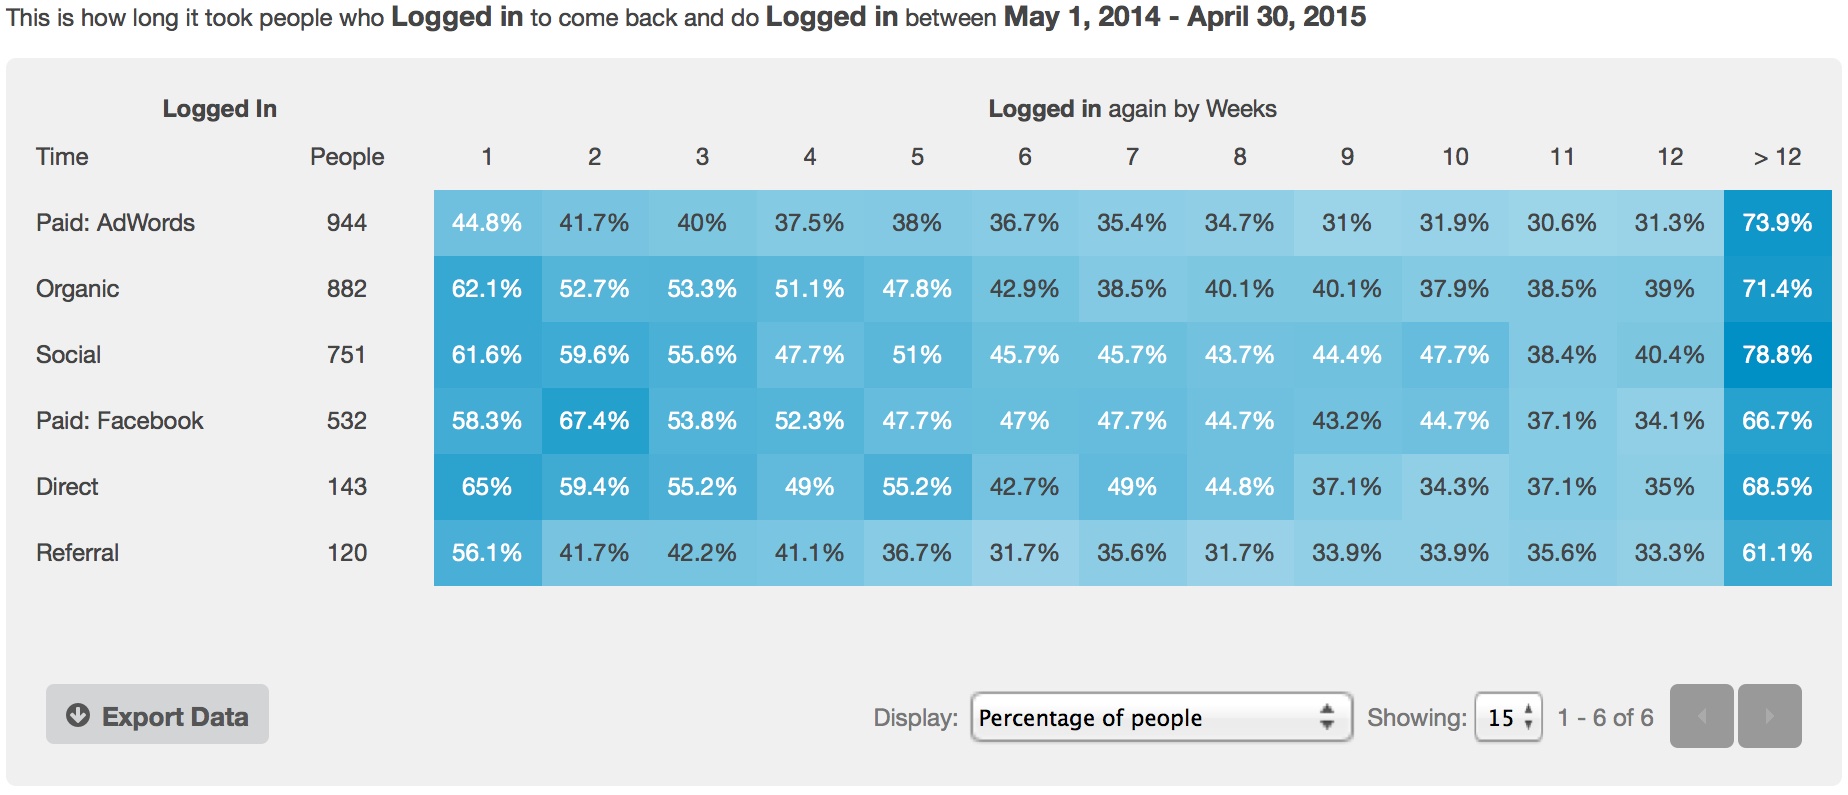
The Cohort Report helps us quickly identify some of the higher percentages by marking them with a white color. We can see that Social (people who came from a non-ad link from a social site) and Paid: Facebook (Facebook Ads) have the strongest performance. This gives us some assurance that the customers we’re getting from Facebook Ads and Social will be more loyal than other channels. It also tells us that we are targeting the right people.
Referral (visits from 3rd party sites) is one of the poorer performing channels. Not only does it have fewer people logging in, but it also has poor engagement. Given this data, we shouldn’t spend a lot of time trying to get referral traffic.
The Next Steps
This report gave us a lot of useful data. Here are a few points we can take away:
- Facebook, Social, and Direct have strong engagement. We’ll have to look at the cost to acquire customers from Facebook Ads to see if it’s a profitable channel.
- AdWords gets a lot of people, but has poor engagement. Here, too, we’ll have to see what we’re spending on AdWords to see if it’s worth the cost.
- Organic (people who come from a search engine) has a strong base and above average performance. We should do what we can to get more people from organic searches.
Use the KISSmetrics Cohort Report to Track Acquisition and Retention
This is only one example of what the KISSmetrics Cohort Report can do. Any time you want to track acquisition and retention, use the Cohort Report. Also, you don’t have to stick with segmenting people by Channel: Origin (although it works right out of the box with KISSmetrics). If you’re using UTMs, KISSmetrics will automatically pick them up and you’ll be able to segment people by any parameter.
Here are some other ways the Cohort Report can be used for both SaaS and ecommerce companies:
SaaS:
- Track customer retention
- Track product and feature engagement
- See the length of time it takes for customers to churn after signing up
- Track login retention for new customers
- See how long it takes for visitors to sign up after their initial visit
Ecommerce:
- Track repurchase rates
- See which products get returned most often
- Segment by marketing channel to learn which channels bring the most purchases
- Track which product categories (or products) have the highest repurchase rates
- See which products/product categories lead to the most customer referrals
Once you get KISSmetrics set up and all the events firing, you’ll be able to view your data and make marketing and product decisions off the quantitative feedback.
Two-Minute Demo
Want to learn about the KISSmetrics Cohort Report without reading a blog post? No problem, just click Play below to get a quick synopsis:
Ready to see how KISSmetrics benefits your business? Sign up for a 14-day free trial today. You’ll get access to our reports, which can help guide decision-making and growth.
Want to poke around KISSmetrics without signing up? No problem, just visit our Demo site where you can see how KISSmetrics benefits both SaaS and ecommerce companies.
About the Author: Zach Bulygo (Twitter) is a Content Writer for KISSmetrics.
No comments:
Post a Comment