Have you ever wondered how your email open and click through rates fare against others in your industry? What about bounce rates and unsubscribe rates? Which industries have the best performance and what can you learn from them? A new study just released by Silverpop aims to answer these questions and provide greater insights into the metrics you should be measuring with every message, along with the core numbers you need to accurately gauge your performance. Let’s take a closer look.
A 50%+ Open Rate?
How would you like it if over half of your subscribers opened your message? Sounds like an email marketers dream come true, right? Well, if you’re in the travel, tourism or hospitality industries, that’s the number to beat, according to the study:
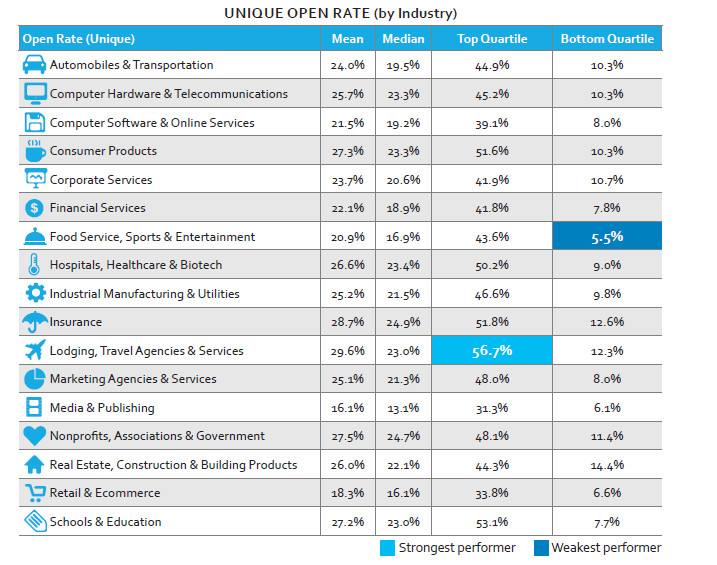
Top performing lodging and travel emails enjoyed a 50%+ open rate
The lowest mean performers on the scale were the retail, e-commerce, media/publishing industries. A solid chunk of Kissmetrics readers fall under the latter category, but this doesn’t mean you should be disheartened. Businesses in these industries typically send emails often, so frequency can work against them depending on the message. Travel and tourism sites, on the other hand, typically only send out messages when there’s a targeted deal to be had based on the subscriber’s chosen destination, so it’s to the user’s benefit to open that message quickly or risk missing out.
Digital publishers don’t have that same kind of urgency – you’ll never run out of stock of your cloud based application or service, so in the user’s mind, it gets relegated to the back burner.
Transactional Emails Have Nearly Double the Open Rates
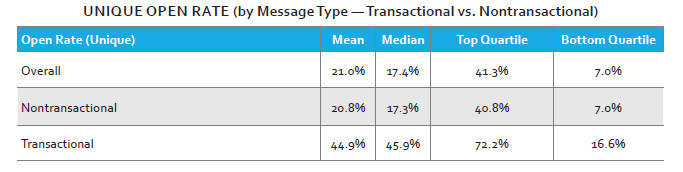
This one should come as no surprise: transactional emails (emails triggered by a user’s action such as a subscription or a receipt) garner a much higher open rate than non-transactional emails. Many people don’t know this, but transactional doesn’t always mean that there’s money involved. In other words, it doesn’t always have to be an order receipt, although it can be.
Transactional emails cover any action a user takes which will result in another action, such as:
- Confirming their subscription to a newsletter
- Resetting their password
- Getting a receipt or a shipping notification
- Submitting a support ticket
- Abandoning their shopping cart
And so on. Non-transactional would be emails from the company that don’t hinge on a user’s action, like “We’re moving to a new office in Hiptown USA” or “We’re having a widget blowout sale!”
What many businesses forget is that these transactional emails provide a prime opportunity to build and foster a stronger relationship with the customer. Up-sells, cross-sells and other well-timed, targeted promotions of things related to their purchase are much more likely to get acted upon when they’re already in the purchasing mindset to begin with.
What About Click-Through Rates?
Open rates are great – but the click is the holy grail of email marketing. Here, according to the study, computer hardware and telecommunications was the top performing industry – likely because of new innovations in the mobile and wearable tech sectors from major players like Apple and Samsung.
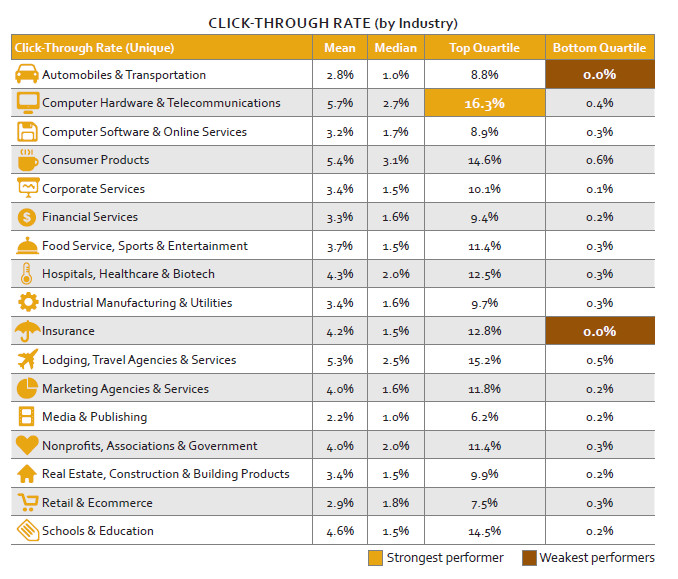 Computer hardware and telecom industries have some of the highest CTRs
Once again, retail fell to the bottom of the pack. But before you write off retail and e-commerce industries completely, you should know that this industry performed much stronger among the unique click-to-open rates:
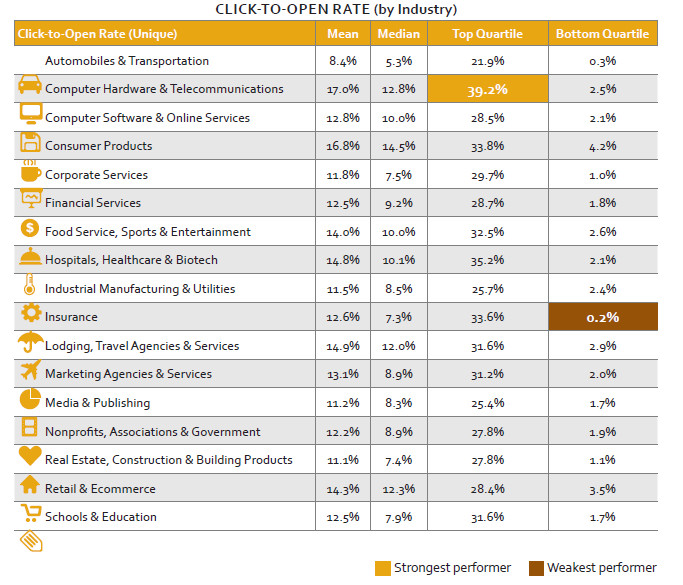
This proves once again that if you’re simply looking at raw standalone click and open numbers, you’re only getting part of the picture. The full report even goes into details on how many clicks per user emails in various industries were shown to generate.
What About List Churn?
List churn is the skeleton in the closet that most industries don’t like to talk about, and for good reason. Things like a lack of engagement, a disconnect between the message and the subscriber, and poor sender reputation can all affect who stays subscribed and who leaves. The study first measured hard bounce rates – meaning email addresses that were returned with not found, unavailable, or other error messages.
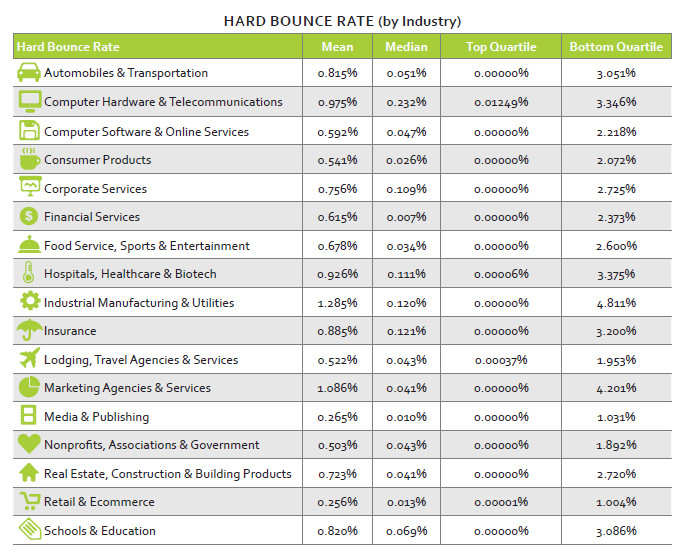 Email frequency may significantly affect hard bounce rates
Retail and e-commerce industries had the lowest amount of list churn (0.26%). This likely has to do with the frequency of mailings. Consider on the opposite end of the spectrum you have industrial and manufacturing companies, who rarely send out emails. In that time, people switch email accounts, internet providers and other issues causing mail to be rerouted into the internet abyss.
Finally, we have the unsubscribe rate. Real estate and building industries lead the pack here and it’s easy to see why – people move in, out, have their home or addition constructed and life goes on. They feel they no longer need those services and they unsubscribe.
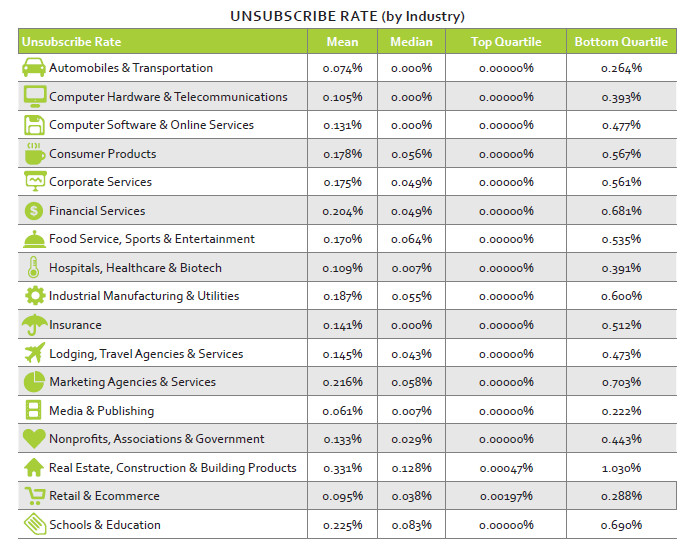 What can you learn from other industries’ unsubscribe rates?
If your unsubscribe rate is particularly high, look at ways to keep those subscribers before they bail. One ideal way to do this is by creating an unsubscribe preference area. Rather than give users a one-click unsubscribe option, give them more choice. For example, you could let them:
- Only be notified about the most important events rather than every sale or announcement
- Receive a more “digest style” email once a month instead of lots of emails every week
- Change the email address where they receive notifications
This tells the user that you’re attentive to their needs as a subscriber – and that you want to make the effort to stay in touch, on their schedule.
The Bottom Line on Email Metrics
Throwing all these numbers at you won’t matter much unless you take into account your own experiences within your industry. Consider your email marketing program, your own benchmarks and the historical data you’ve collected for your own results. This will let you make a more honest, accurate comparison between how well your messages are truly performing, and what the industry standard is.
Have you fund some surprising correlations between your industry and the numbers from the Silverpop study? Have your own messages outperformed their findings? Share your stories and comments with us below!
About the Author: Sherice Jacob helps business owners improve website design and increase conversion rates through compelling copywriting, user-friendly design and smart analytics analysis. Learn more at iElectrify.com and download your free web copy tune-up and conversion checklist today!
No comments:
Post a Comment