Ever played the game Frogger?
It’s a fun, time-wasting game where you try to get a frog across busy traffic. If you fail to get him across the street, the frog gets hit by a car, and you lose.
The game was featured in an episode of Seinfeld, in which the bumbling character George Costanza tries to get his beloved arcade game across a busy New York City street.
As you can see, it doesn’t work out well for George.
In a way, this Frogger game, where you try to get the frog safely across the street, is a lot like your onboarding process. Stay with me here.
Your new users, the frog, need to get to the other side of the street, where they have your product set up and are using it. It’s your challenge to create a path for that success.
The best way to improve this path is to measure how effective your current process is. And, thankfully, Kissmetrics has two reports that are particularly useful for this challenge.
Let’s dig in.
Discover Where New Users Drop Off with a Funnel Report
Your goal: To get as many users as you can to successfully go through your onboarding process.
The tool to help you optimize this: The Kissmetrics Funnel Report.
This report is used to see where users drop off in a flow. This could be a signup flow, checkout flow, or, in our case, an onboarding flow.
Since most SaaS companies have their onboarding flows broken down into a few steps, they can use the Funnel Report to track where they’re losing the majority of new users.
The Use Case
Your new users are excited to start trying your software. The last thing they want is to go through 10 steps before they can start.
This is why most SaaS companies have boiled their onboarding down to a few steps. Users sign up, go through a few (crucial) steps, and then they can begin using the software.
Here’s the onboarding flow for an example SaaS company:
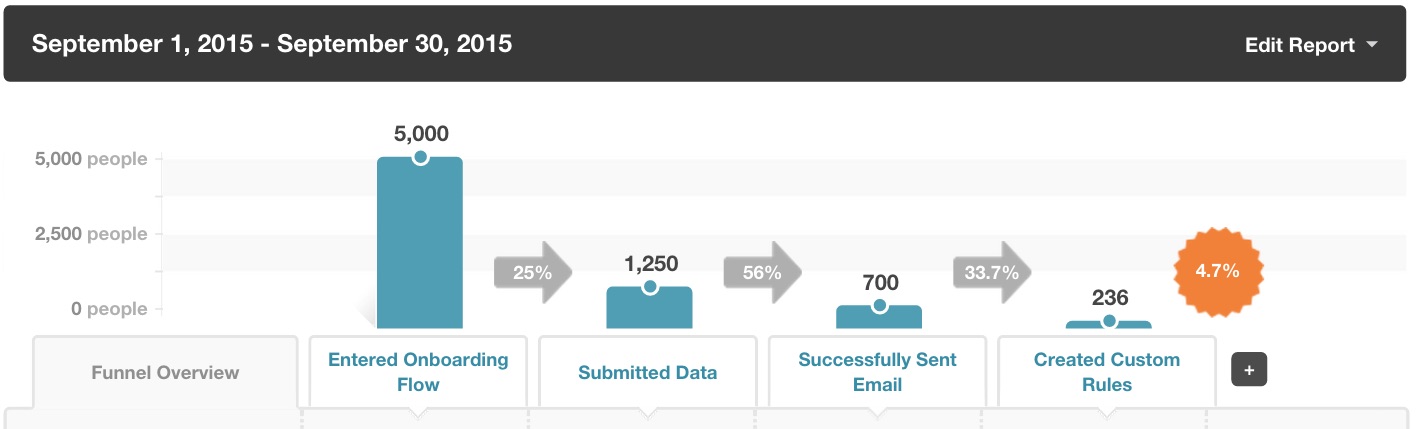
See where the big drop-off is?
It’s right after step one. People enter the onboarding flow, but then 75% of them leave after the first step. And, by the end of the onboarding process, only 4.7% of users are still with the company. That’s a big problem. And it’s not a problem with the users. It’s a problem with the SaaS company.
Let’s look at it another way:
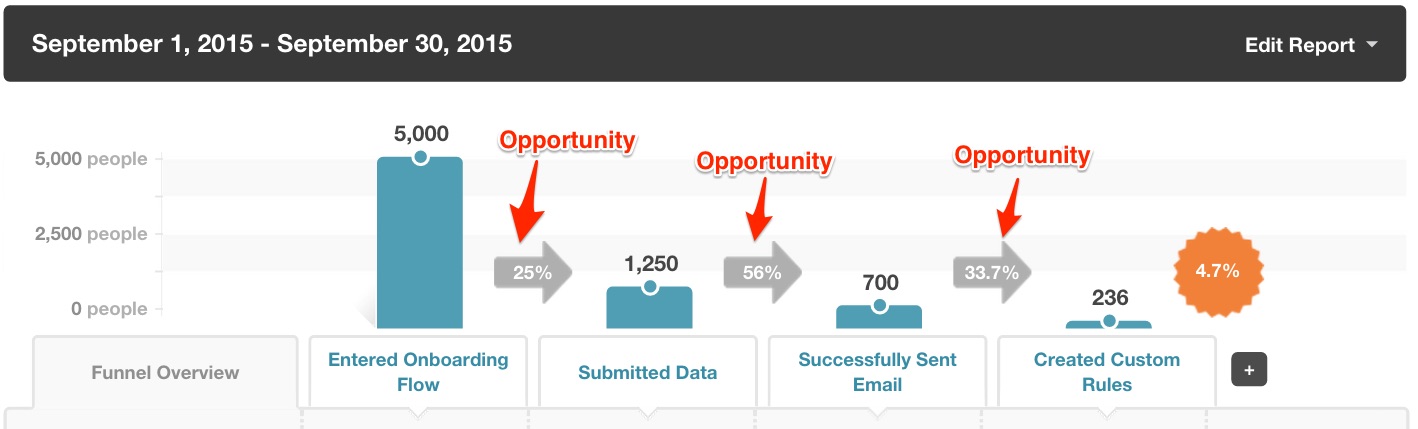
If this were your data, you’d know that you have a huge opportunity in front of you! You’re acquiring new users. Now you just need to move more of them through your onboarding flow so they are set up for success and, hopefully, will become paying customers.
So, we know iteration is needed. What’s the next step?
An A/B test, of course! And, luckily, you don’t have to leave Kissmetrics to get actionable data from your A/B test.
Plug the Gaps with A/B Testing
A/B tests are great. They allow us marketers to increase conversions with the same amount of traffic. And the Kissmetrics A/B Test Report has become a marketer’s best friend. Here’s why:
With the A/B Test Report, you can see how a test impacts any part of your funnel. So, in our example, we’ll need to run a test on the first step of the onboarding flow (Entered Onboarding Flow). Then, because we are using the Kissmetrics A/B Test Report, we aren’t limited to viewing just the people who move to the next conversion. We can track all the way down to the final step (Created Custom Rules). This allows us to see the true performance of each variation.
So, let’s say we run a test on the first step of the onboarding flow. Here are the results in the A/B Test Report:
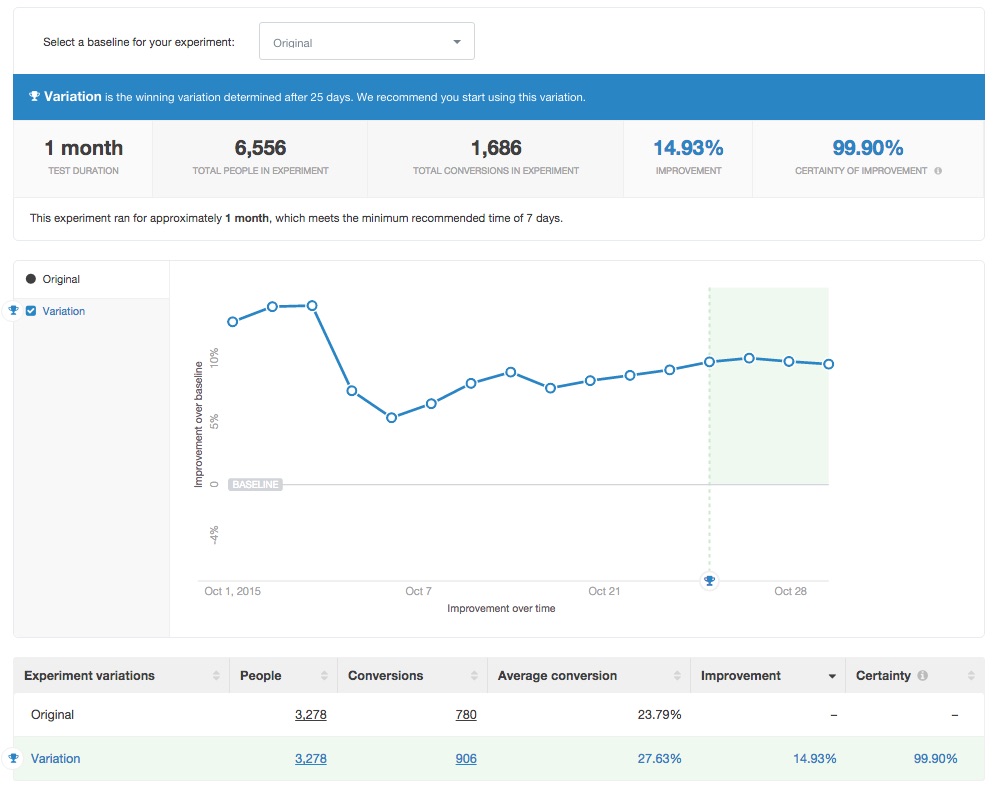
The variation is a big winner. There is a nearly 15% improvement over the original, with over 99% certainty.
If you ran this A/B test but were not using the Kissmetrics A/B Test Report, you might think, “Let’s roll with the variation. It’s a clear winner.” But since you’re a savvy online marketer using the Kissmetrics A/B Test Report, you know that you need to test the results throughout your entire funnel. So, next, you check to see how each variation performs at the final step, Created Custom Rules. And these are the results:

Quite a difference! The original handily beat the variant. This means that somewhere along the onboarding flow, fewer users in the variant completed each step, including the final step. If we had looked at only the next conversion step, we would have mistakenly launched the variant, which would have cost us money and brought fewer users through the onboarding process.
In other words, fewer of our frogs would have crossed the street. Most of them would have been hit and knocked out somewhere along the way.
This is the value of the A/B Test Report. By seeing how a test impacts your entire funnel, you’ll save yourself from launching false positives (i.e., tests that appear to be winners but actually aren’t), which can save you money.
Build, Measure, Learn
And THAT is how you can get more users across the street. You build a better path for them, and they will follow.
This can only be done through constant testing and iteration. Now you know how to do it, and Kissmetrics is the software to help you get there.
Signups will get people through the door, and a successful onboarding process will get them to stay. These two (signups and onboarding) go hand in hand and cannot be ignored. They must be optimized.
These funnels and A/B tests can be done throughout your site. Improve a signup flow, product flow, or a purchase flow. And, if you need help figuring out which areas of your site need A/B testing, then this article can help you.
We’d love to show you how Kissmetrics can help optimize your marketing. Click the button below and fill out the form if you’d like a personal demo.
About the Author: Zach Bulygo (Twitter) is a Content Writer for Kissmetrics.
No comments:
Post a Comment